
Amdahl’s law and changes in critical path
Augmentation of hardware and software resources is a classic technique that is often adopted by IT teams to improve the performance of applications. However, it is commonly observed that, contrary to expectations, the increase in the computing resources does not necessarily lead to improvement in the performance, as expected. This situation presents unique challenges to the IT teams as they grapple to analyze the reason for the inefficacy of the technique in improving performance.
Failure to enhance performance can be attributed to multiple causes - some trivial like incorrect configuration of the new environment as well as some severe like architectural flaws or mandatory architectural requirements that prevent scaling. One such aspect of the architecture that can have a significant bearing on the performance improvement is the behavior of the critical path in the application flow under varying workload conditions. The path termed as Critical Path is the longest path (in terms of time) in the system and determines the minimum time for completion of requests. Analysis of the Critical Path in the application is a vital check point as it can expose reasons for failure in achieving expected performance improvements. Normally, it is assumed that the critical path in the system does not change with changes in the workload. However, in applications which have parallel application flows, this assumption may lead to incorrect performance analysis thus leading to solutions which do not address the actual performance bottleneck.
In subsequent sections, I will explore a methodology for identifying the critical path under different workloads and its implication on the performance analysis process.
Performance Issues - A Typical Solution
A real-life example of an enterprise application that has multiple parallel application flows is presented below. The example illustrates a Billing Mediation System that calculates the billing amount and then routes the bills to appropriate Billing servers.
An example is the Billing Mediation System diagramed below. The BMS calculates the billing amount and, then, routes the completed bill to the appropriate Billing servers.
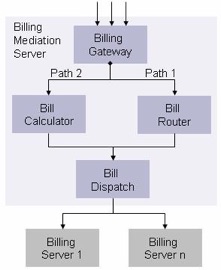
The Billing Gateway component in the mediation system receives the requests and then invokes the Bill Calculator and the Bill Router components, in parallel, to reduce the time taken to processes the request. The generated bill is passed to the Bill Dispatch component which dispatches the bill to the appropriate Billing server as identified by the Bill Router. It is important to note that the bill cannot be dispatched unless both Bill Calculator and Bill Router complete their processing. The Bill Router component requires significantly more processing; hence, the service time of the request in the Bill Router is higher than the Bill Calculator. The Bill Router component becomes the critical path.
Performance tests were conducted at low loads in a scaled down version of the production environment. Performance models [1] were created and parameterized with measurements (CPU, IO, Response time) taken during testing and the performance characteristics were extrapolated to understand the potential performance characteristics at the expected load. Hypothesis based on the performance models indicated that the application would meet the desired performance goals once deployed in the target production environment, which has considerably more resources. The application was deployed in the production environment and tested at the actual workload. It was observed that the actual performance characteristics did not meet the predicted performance characteristics. Discrepancies were not observed in the environment settings and none of the resources on the system (CPU, memory, network, etc.) were saturated.
Initial Analysis And Observations
The Billing Mediation System can be envisaged as a network of interdependent activities; hence the critical path technique [2] was adopted when analyzing the performance of the application. The Critical Path technique was used to identify the longest path in the network as it determines the response time of the request. Observation of component service time in the production environment revealed that the Bill Calculator component consumed more time for completion than the Bill Router component, contrary to observations in the performance testing environment. Analysis of the component service time indicated that the critical path observed in the production environment (Billing Gateway- Bill Calculator - Bill Dispatch) was different than the path observed in the performance test environment (Billing Gateway- Bill Router- Bill Dispatch). The application team had assumed that the critical path will remain unchanged across workloads and hence the response time figures from the test environment were extrapolated to derive the response time/ throughput for a given workload.
In the subsequent section we try to validate the assumption that the critical path remains unchanged across workloads. This will lead us to correct identification of critical path for any given workload.
PERFORMANCE FORECASTING AND CRITICAL PATH ANALYSIS
Amdahl’s Law gives maximum speedup possible in parallel processing systems. Amdahl’s law states that if P is the proportion of a program that can be made parallel, i.e. benefit from parallelization, and (1 − P) is the proportion that cannot be parallelized, i.e., remains serial, then the maximum speedup that can be achieved by using N processing threads is:
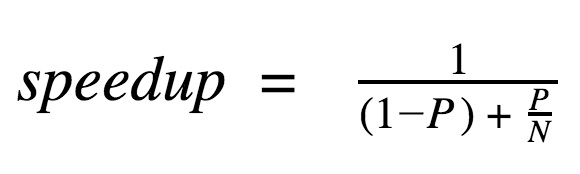
As evident from equation, the possible speedup decreases with increasing N. Hence, even for a small fraction of serialization, the rate of performance gain falls rapidly as N is increased.
Modern Enterprise systems are concurrent by design; therefore, they handle changes in the workload by corresponding changes in threading. In the context of enterprise applications, the general assumption is that the throughput of the system will increase as we add more workload and computing resources. In the absence of serialized paths, the system should be able match the increase in the workload with corresponding increase in the throughput, provided enough computational resources are available. However, even a small percentage of serial path usage will lower the throughput of the system as illustrated below.
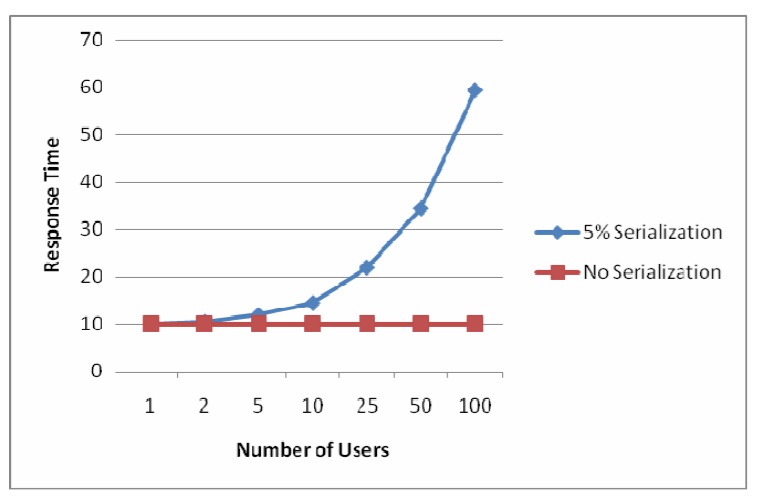
fig.1 - Response time for 5% and 0% serialization
The chart in fig.1 shows response time for 0% and 5% serialization under different workloads for a flow which takes 10 seconds to respond to single request. The response time for different workloads (number of user requests) is calculated using Amdahl’s law. As evident from the chart, even for a small percentage of serialization in the execution path, the response time of the execution increased drastically.
Typically, in performance testing, the 90th percentile measure is used to determine if the application response time is within the SLA agreed, i.e., 90 % of the requests should have response time less than or equal to agreed SLA. The response time will be affected by the parallel paths in an application and the serialization levels in those paths.
Consider an example where one of the parallel paths takes 10 seconds for completion and has 5% serialization and the second path takes 7.5 seconds for completion but has 7.5% serialization. fig.2 shows 90th percentile response time for various user loads for these parallel paths mentioned above.
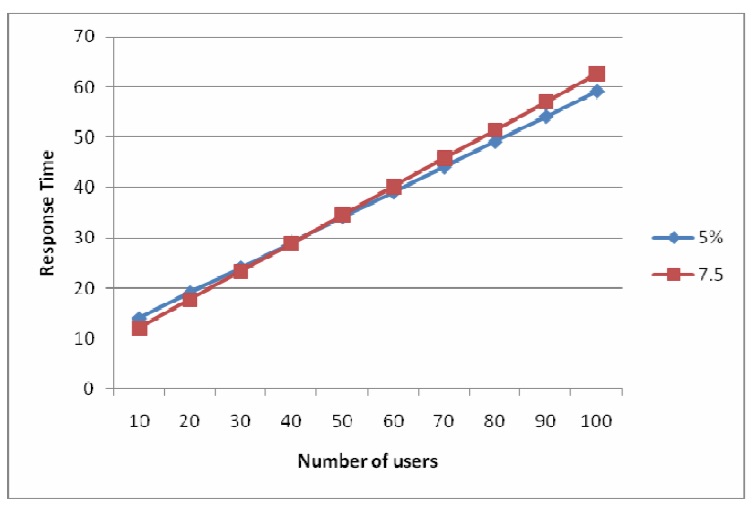
fig.2 - Response time for 5% and 7% serialization
The path with 5% serialzation is the longest path till the number of users reaches 45 but, after that, the path with 7.5 % serialzation becomes the longest path. This insight will be useful in the context of forecasting the performance characteristics based on data (CPU utilization, response time, network utilization, etc) collected in a performance testing environment.
Typically the performance test environment is a scaled down version of the production environment and the test workload is also scaled down proportionally. The performance characteristics observed in a performance test environment are extrapolated to understand the characteristics in the production environment for an increased workload. During extrapolation, it is assumed that the critical path remains unchanged across different workloads. It is also assumed that the rate of increase in throughput will remain the same as observed in the test environment. However, the graphs above indicate that the assumptions are incorrect since the critical path has changed and the rate of increase in throughput is also different as the workload increased.
In the Billing Mediation System described earlier, performance tests were conducted at low loads in a scaled down test environment and the data was used for forecasting the performance in the production environment. The forecasting technique used did not consider the presence of parallel paths, the level of serialization in those paths and the effect of changes in workload on the critical path. This led to incorrect performance forecasting and the subsequent performance issues observed in the production environment.
Application Of Amdahl’s Law In Critical Path Analysis
The architecture validation phase is conducted during/after architecture definition to validate the capability of the architecture to sustain the expected workload and meet the SLAs. During this phase, the critical elements of the architecture are prototyped and measured to understand the effect of the expected workload on the architecture. It is important to identify parallel paths for performance critical use cases in the application and prototype them. The prototype must be tested with varying workloads (not necessarily the target workload) to identify the quantum of serialization in each path using Amdahl’s Law. The quantum of serialization will have an effect on the response time of each request.
Once the measurements from prototype are recorded, the data will be used for curve fitting based on the Amdahl’s Law. The curve fitting exercise will yield quantum of serialization in each path, which is then used for extrapolation to determine the critical path and response time for a given user load. The step can be illustrated in diagrammatic form
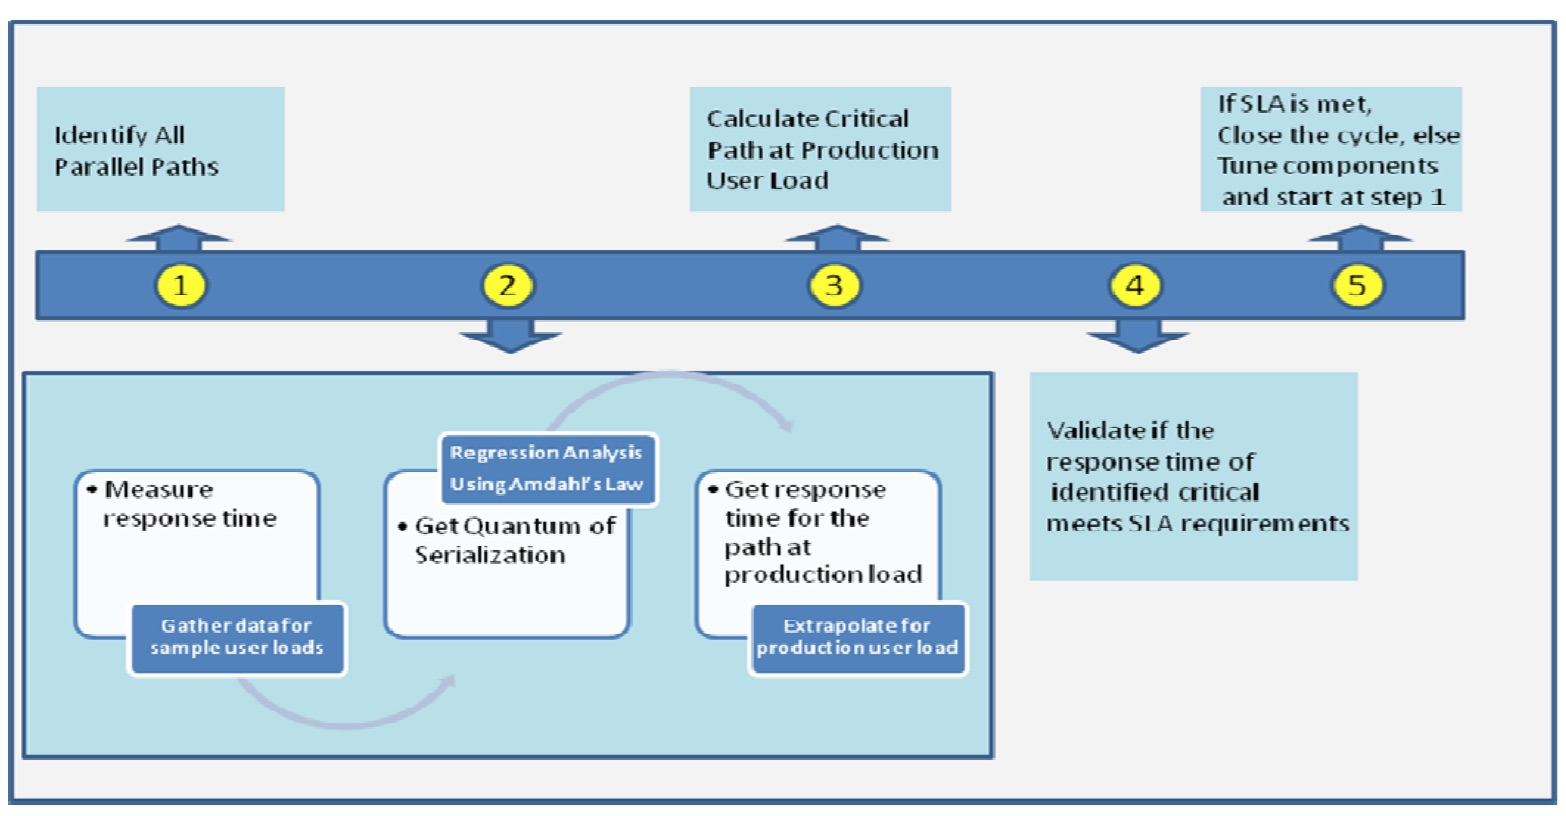
fig.3 - Sequence of steps for application of Amdahl’s law in critical path analysis
The box below illustrates use of Amdahl’s Law to project response time for a particular path at various workload levels.
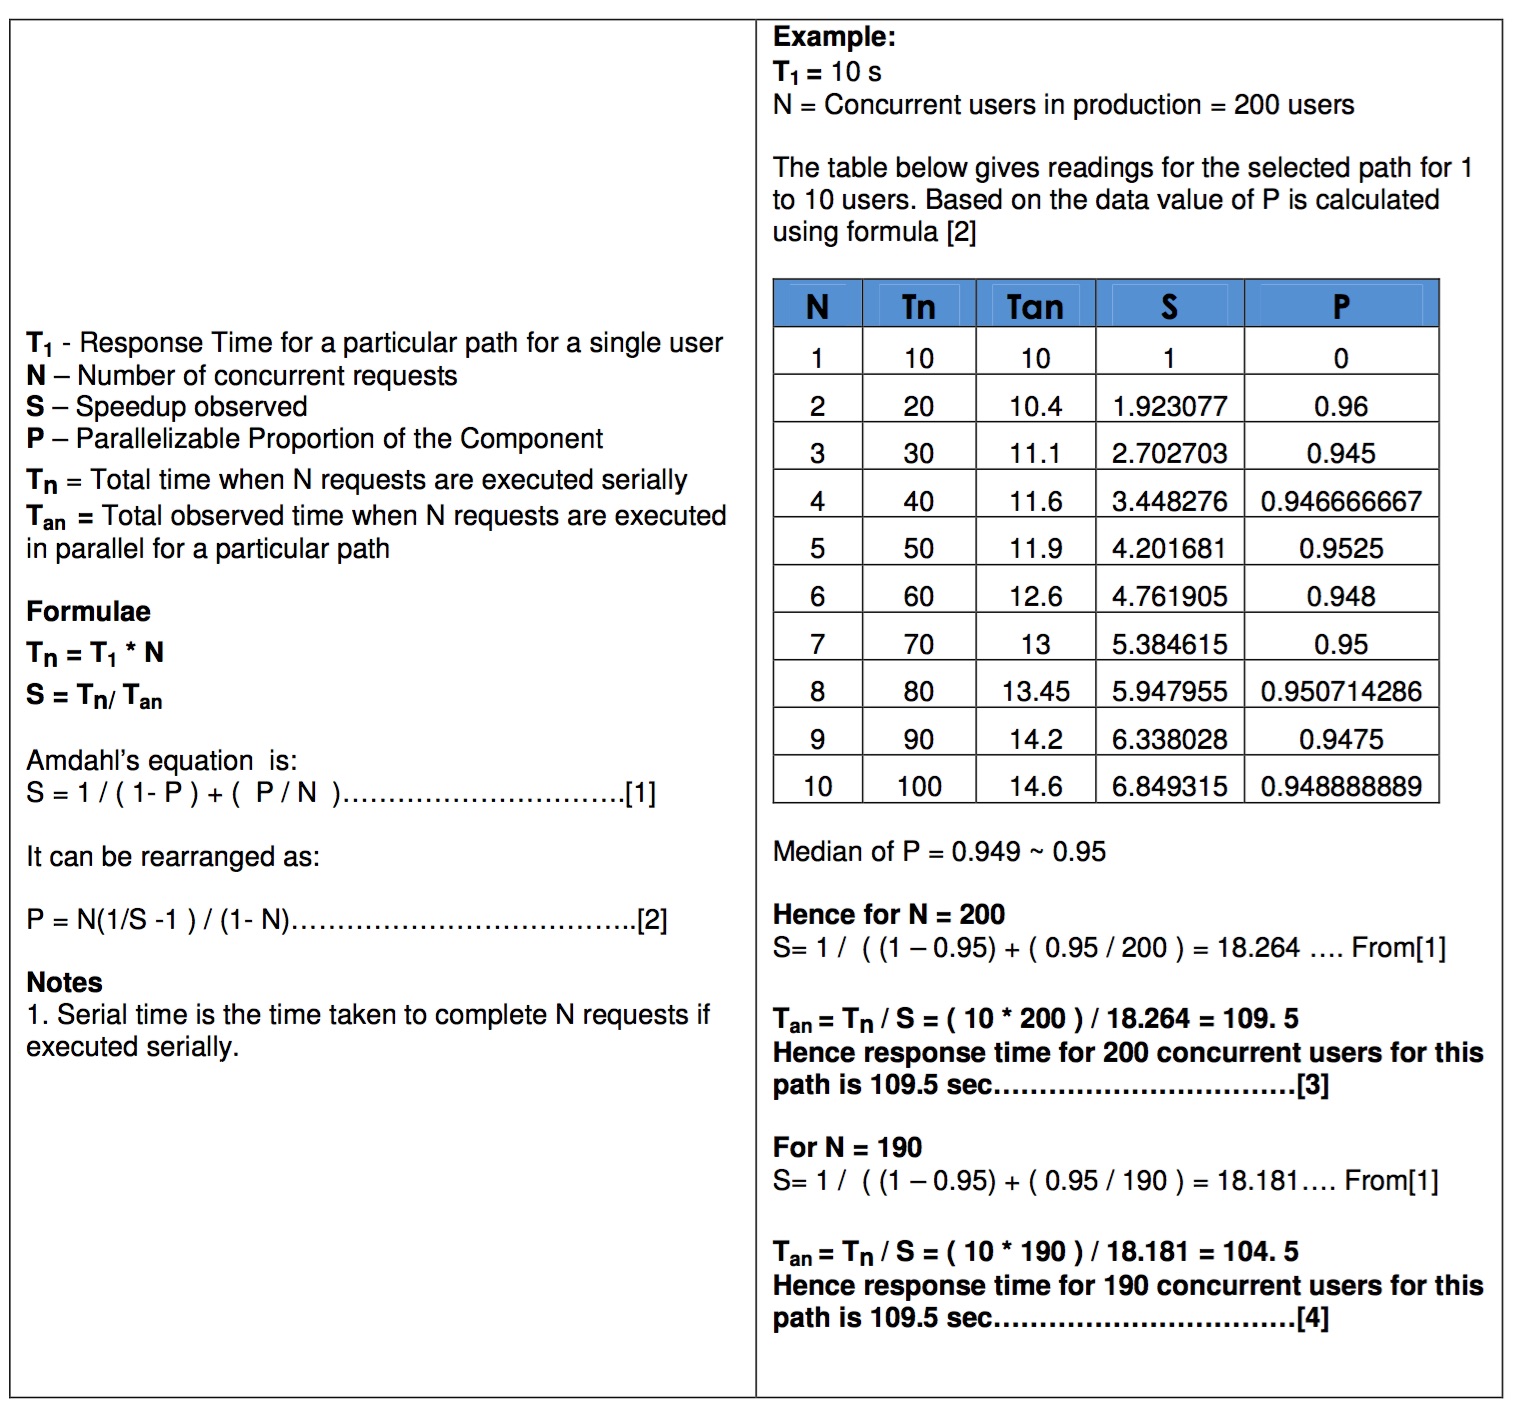
Percentile response time based on the requirements (90 percentile, 95 percentile etc) can be derived from the parallel time calculated for different number of requests to check conformance with the SLA’s. Because of serialization, the response time will add up for each incremental user. Hence to determine percentile time, first percentile user number needs to be calculated. From the user number derived, the required percentile response time can be obtained. For example if there are going to be 200 concurrent users, the 95th percentile of concurrent users is 190 users. So for the 190th user the response is seen as 104 (refer calculation [4] in example above).
Conclusion
During performance analysis and forecasting it is important to identify all parallel paths for a given use case and their serialization characteristics using Amdhal’s Law. The data gathered from this activity helps in identifying the correct critical path for a given workload to accurately predict performance of the use case. The technique can also be applied to wide ranging areas such as Business Process Modeling and Grid Technologies which take advantage of parallel processing.
References
- Computer System Analysis Using Queuing Network Models, Edward Lazowska, Prentice-Hall, Inc., 1984
- “Critical Path Analysis for the Execution of Parallel and Distributed Programs”, Yang, C.-Q.; Miller, B.P. 1988., 8th International Conference on Distributed Computing Systems, Volume, Issue, 13-17 Jun 1988 Page(s):366 – 373
- http://en.wikipedia.org/wiki/Amdahl%27s_law